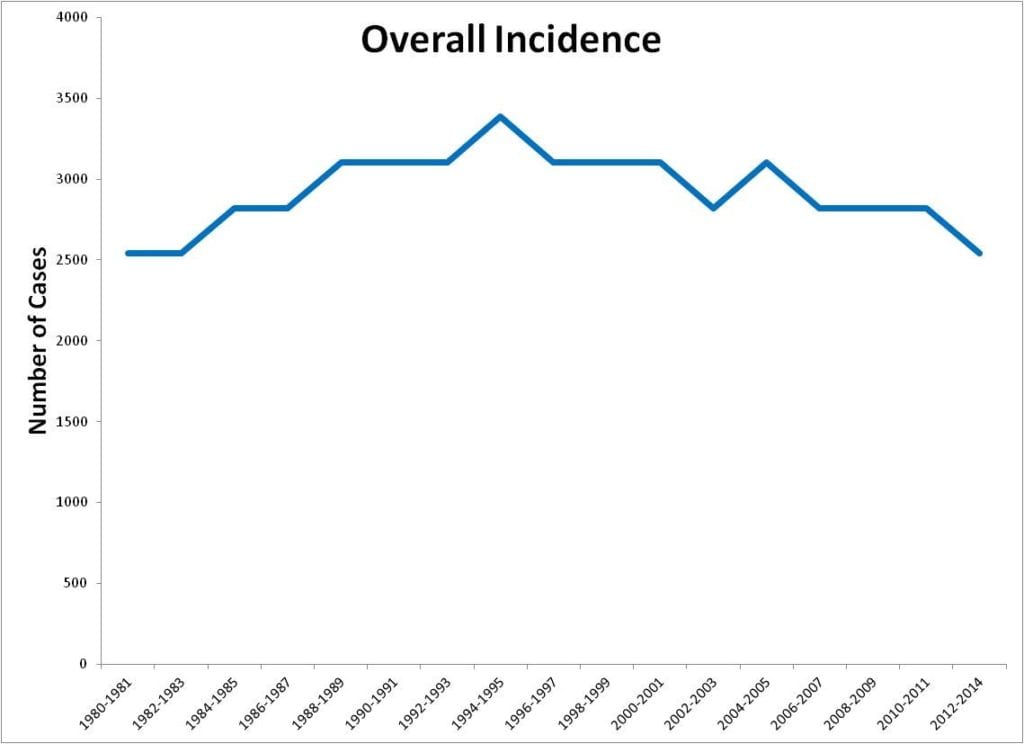
This chart shows the rate of mesothelioma in the U.S., independent of the increasing population. It appears to have peaked in the mid 1990’s and is now slowly declining. This is probably due to the fact that there are fewer asbestos products sold in the U.S.
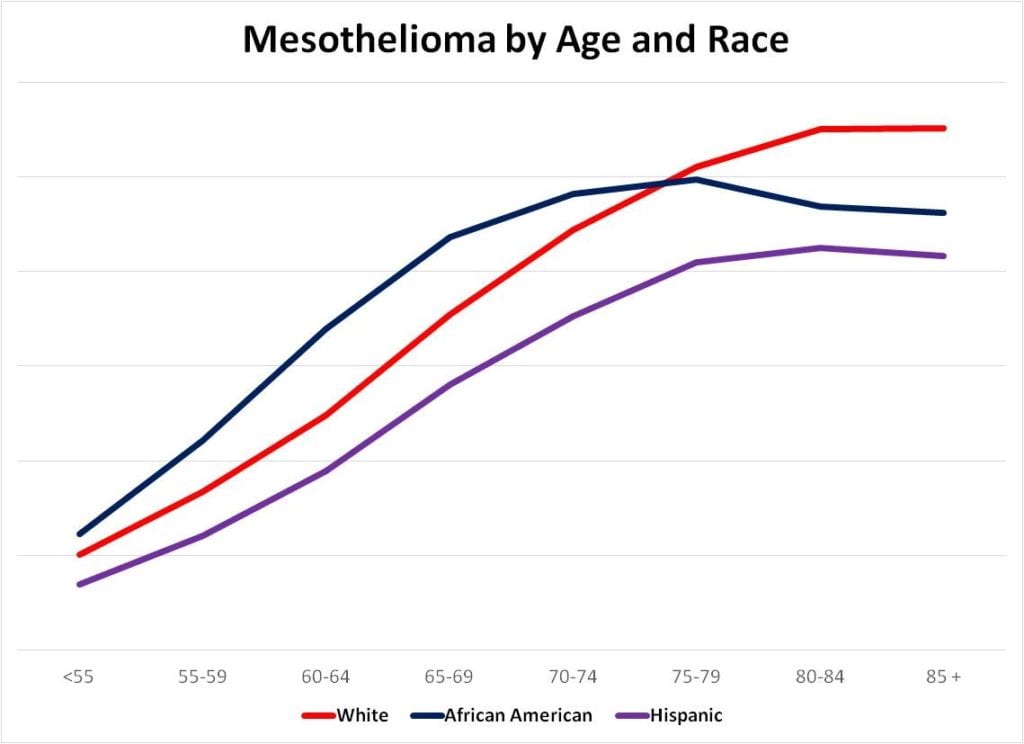
This chart shows the rate of mesothelioma in the U.S. by age for Whites, African-Americans, and Hispanics. The lines track together, but the rates are highest for Whites.
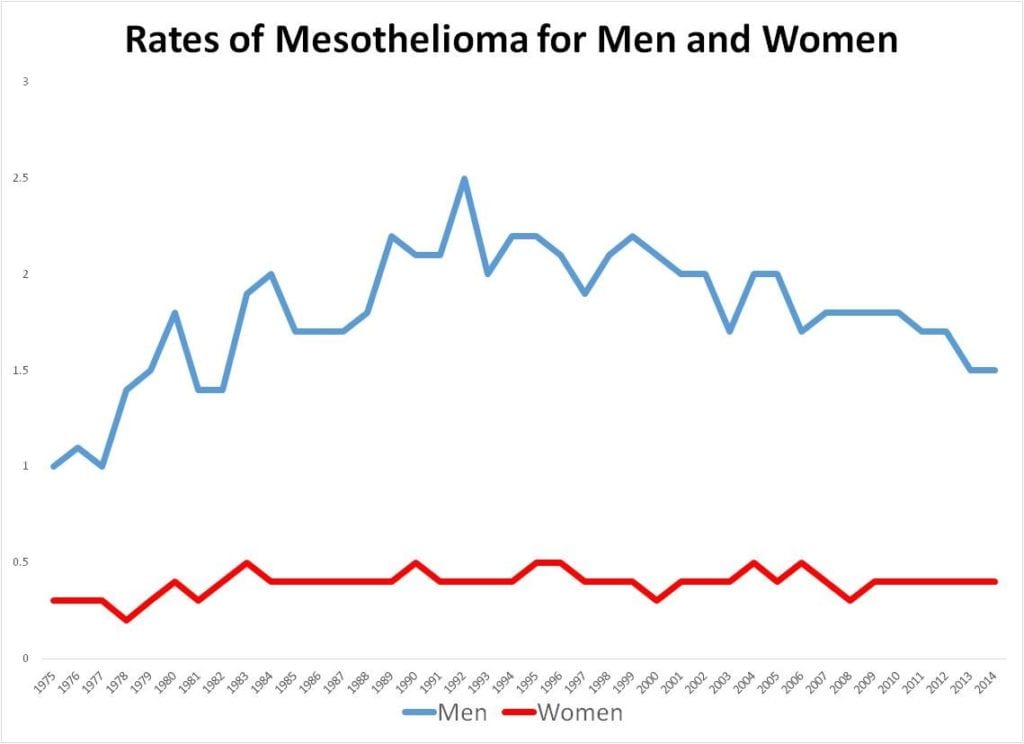
This chart compares the incidence rates of mesothelioma in the U.S. for men and women from 1975-2014. It’s clear that the rate for women is about one-quarter the rate for men. This is probably due to the fact that men have greater exposure to asbestos. In addition, we see that the peak was in the mid 1990’s but that there is a bigger decrease for men than for women. This difference has not been explained.
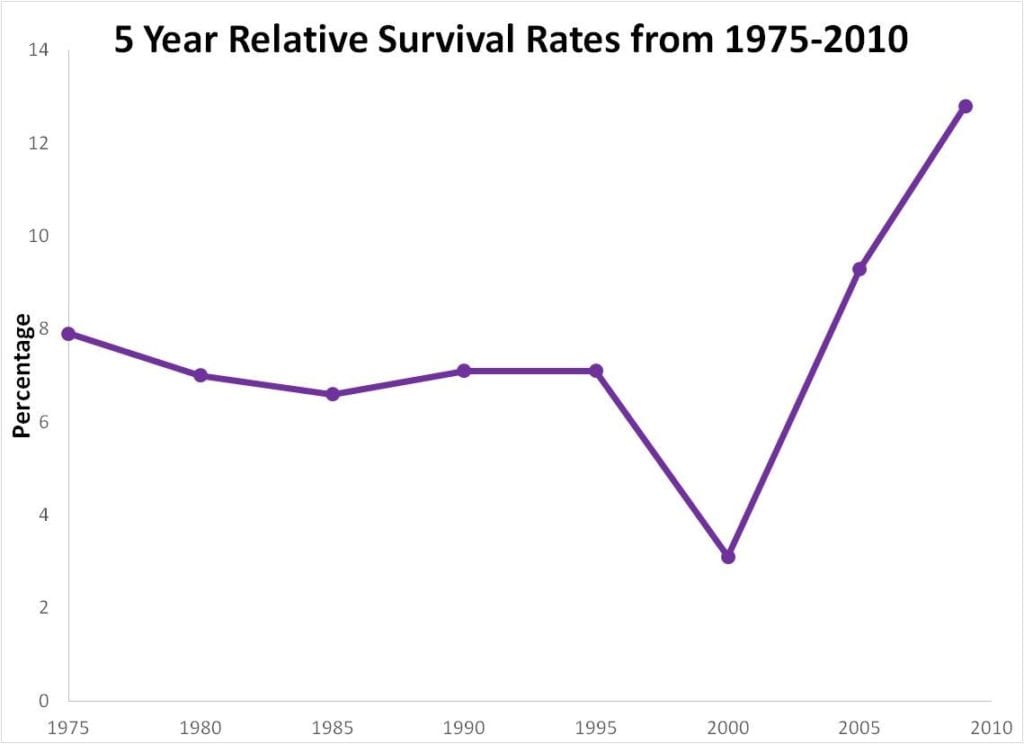
This chart shows the 5-year relative survival rates from 1975 to 2010. Survival rates were flat and even decreasing up to 2000. After that year, survival has steadily increased. This is due, in part, to the introduction of HIPEC for peritoneal mesothelioma and more effective surgeries for pleural mesothelioma.
Related Posts
 Decoding Pleural Mesothelioma: Insights from a Ten-Year Study - Recently, a group of researchers studied 169 patients with pleural mesothelioma over ten years. They wanted to gain a deeper understanding of mesothelioma and its effects on people. Pleural mesothelioma is a serious type of cancer that affects the lining of the lungs. It is caused by asbestos exposure. Doctors have found that the outlook for people with this cancer depends on different factors. They include the type of cancer cells and how far the cancer has spread in the body. A group of researchers studied 169 patients with pleural mesothelioma over a period of 10 years to learn more about this disease and how it affects people. A Look at ‘Performance Status’ The researchers used a special computer program...
 Misleading Symptoms: The Complex Path to Diagnosing Mesothelioma - Patients with symptoms that look like mesothelioma take longer to get an accurate diagnosis, finds a study out of the United Kingdom. The Complex Path to Diagnosing Mesothelioma Mesothelioma is a rare form of cancer that develops from the cells in the lining of many of the internal organs in the body. There are about 2,000 cases of mesothelioma diagnosed in the United States each year. It is caused by exposure to asbestos. Symptoms of mesothelioma may include shortness of breath, chest pain, weight loss, and fatigue. These are so like many other diseases that only a proper work-up, including scans and even a biopsy, can determine if the cause is mesothelioma. Because the disease is so rare, it can...
 New Hope for Mesothelioma Patients in Intensive Care - In the fight against mesothelioma, there’s new and hopeful data that might help patients who end up in the intensive care unit (ICU). A recent study gives us important details about how some patients are getting better, and this is good news for people around the world. ICU Success for Mesothelioma Patients Mesothelioma is a rare kind of cancer caused by asbestos. It mostly affects the lining of the lungs and chest. This can lead to problems like trouble breathing, chest pain, coughing, and feeling tired a lot. But what happens when mesothelioma patients have a very serious health issue and need to go to the ICU? We know that 5% of cancer patients have to go to the ICU...
 Breaking Down Mesothelioma: Diagnosis and Treatment Options - An international team of scientists from India, Malaysia, and Indonesia published an overview of the diagnosis and treatment of mesothelioma. Their report was published in the scientific journal Frontiers in Oncology. Understanding Mesothelioma Diagnosis and Treatment Mesothelioma is a rare and aggressive tumor that grows in the lining of certain body cavities. It usually happens in the chest, abdomen, or around the heart. Mesothelioma is caused by exposure to asbestos, a harmful substance that was once used in many industries. Even though asbestos is now banned in many places, the number of mesothelioma cases is still increasing. Diagnosing mesothelioma is challenging because it can look like more common diseases. To diagnose mesothelioma, doctors often use imaging tests like X-rays, CT...
 Insights from European Mesothelioma Databases - An international team of researchers analyzed data from two mesothelioma databases. They discovered trends about mesothelioma in Europe. These trends can help doctors make better treatment decisions for their patients. Improving Mesothelioma Treatment Mesothelioma is a type of cancer that is both rare and aggressive. It is caused by exposure to a toxic mineral called asbestos. Asbestos is a fiber-like material that can be used in building and manufacturing materials. The two most common types of mesothelioma are pleural and peritoneal. Pleural mesothelioma is found in the lining of the lungs. Peritoneal mesothelioma grows in the abdominal cavity. There are about 2,000 cases of pleural mesothelioma and 1,000 cases of peritoneal mesothelioma each year. There are also three different cell...
 Challenges and Hope: Mesothelioma in Children - Mesothelioma is most often found in older adults, but in a very small number of cases, this cancer is diagnosed in children. There is not much research on mesothelioma in children. An international team of researchers looked at all mesothelioma cases occurring in children, teenagers and young adults diagnosed and treated in Europe. The team is called the European Cooperative Study Group on Pediatric Rare Tumors. Understanding the Unique Challenges in Pediatric Cases Mesothelioma is an aggressive and rare cancer. It develops in the lining of internal organs like the lungs and abdominal cavity. Reaching a diagnosis of this disease can be hard, and treatment can be even more difficult. Mesothelioma is caused by exposure to asbestos. This is a...
 Italy’s Battle Against Mesothelioma: National Case Tracking - A study by Italian researchers shows how tracking mesothelioma cases at a national level can help to measure the impact of asbestos exposure. Unveiling the Toll of Asbestos Exposure Mesothelioma is an aggressive type of cancer, and it is also rare. The cancer grows in the lining of internal organs like the lungs. It is hard to diagnose and treat, and the outlook for patients is usually poor. Mesothelioma is caused by asbestos exposure. Asbestos is a naturally occurring mineral that has been found throughout the world. It used to be widely used in construction and manufacturing before its toxic effects were discovered. Many countries banned the use of asbestos, but other countries continue to use this dangerous material. How...
 Socioeconomic Factors Shape Mesothelioma Outcomes - Socioeconomic and racial factors can play a role in the survival rates of patients with mesothelioma. This finding was presented by a team of researchers at the 2023 annual meeting of the American Society of Clinical Oncology. Mesothelioma Survival Rates Mesothelioma is a rare and aggressive type of cancer caused by asbestos exposure. It mostly affects the lining of the lungs, but also occurs in the abdomen. It is diagnosed in around 2,000 people in the United States each year, which is a very small percentage of all cancer cases. The outlook for people with mesothelioma is not good, with only 7 to 10% of patients surviving for five years. The disease is usually diagnosed when people are older because...
 Mesothelioma Care: Why Academic Centers Hold the Key to Improved Survival - Researchers from the Mayo Clinic found out that people with mesothelioma who were treated at academic centers had a better chance of living longer than those treated at community centers. They shared their discoveries at the annual meeting of the American Society of Clinical Oncology. Mesothelioma is a type of cancer that is tough to treat, and there aren’t many options for therapy. It happens when someone is exposed to a harmful mineral called asbestos. Surgery, chemotherapy, and radiation therapy are common treatments. The Difference Between Academic and Community Centers Medical centers with expert doctors and more resources are called academic centers. They often see more cases of rare cancers like mesothelioma. But until now, we didn’t know if getting...
 Mesothelioma: Unraveling the Impact of Asbestos Exposure and Predicting Future Trends - Mesothelioma cases have been decreasing around the world over the past 30 years, finds researchers from the Huazhong University of Science and Technology. The Changing Landscape of Mesothelioma Their goal was to look at how the burden of mesothelioma has changed over time and make predictions about future trends. Mesothelioma is a rare cancer that is hard to diagnose and treat. It is caused by exposure to a toxic mineral called asbestos. There are different types of mesotheliomas depending on where in the body it develops. Mesothelioma that grows in the lining of the lungs is called pleural mesothelioma. When it grows in the lining of the abdominal cavity, it is called peritoneal mesothelioma. Mesothelioma has also been found around...